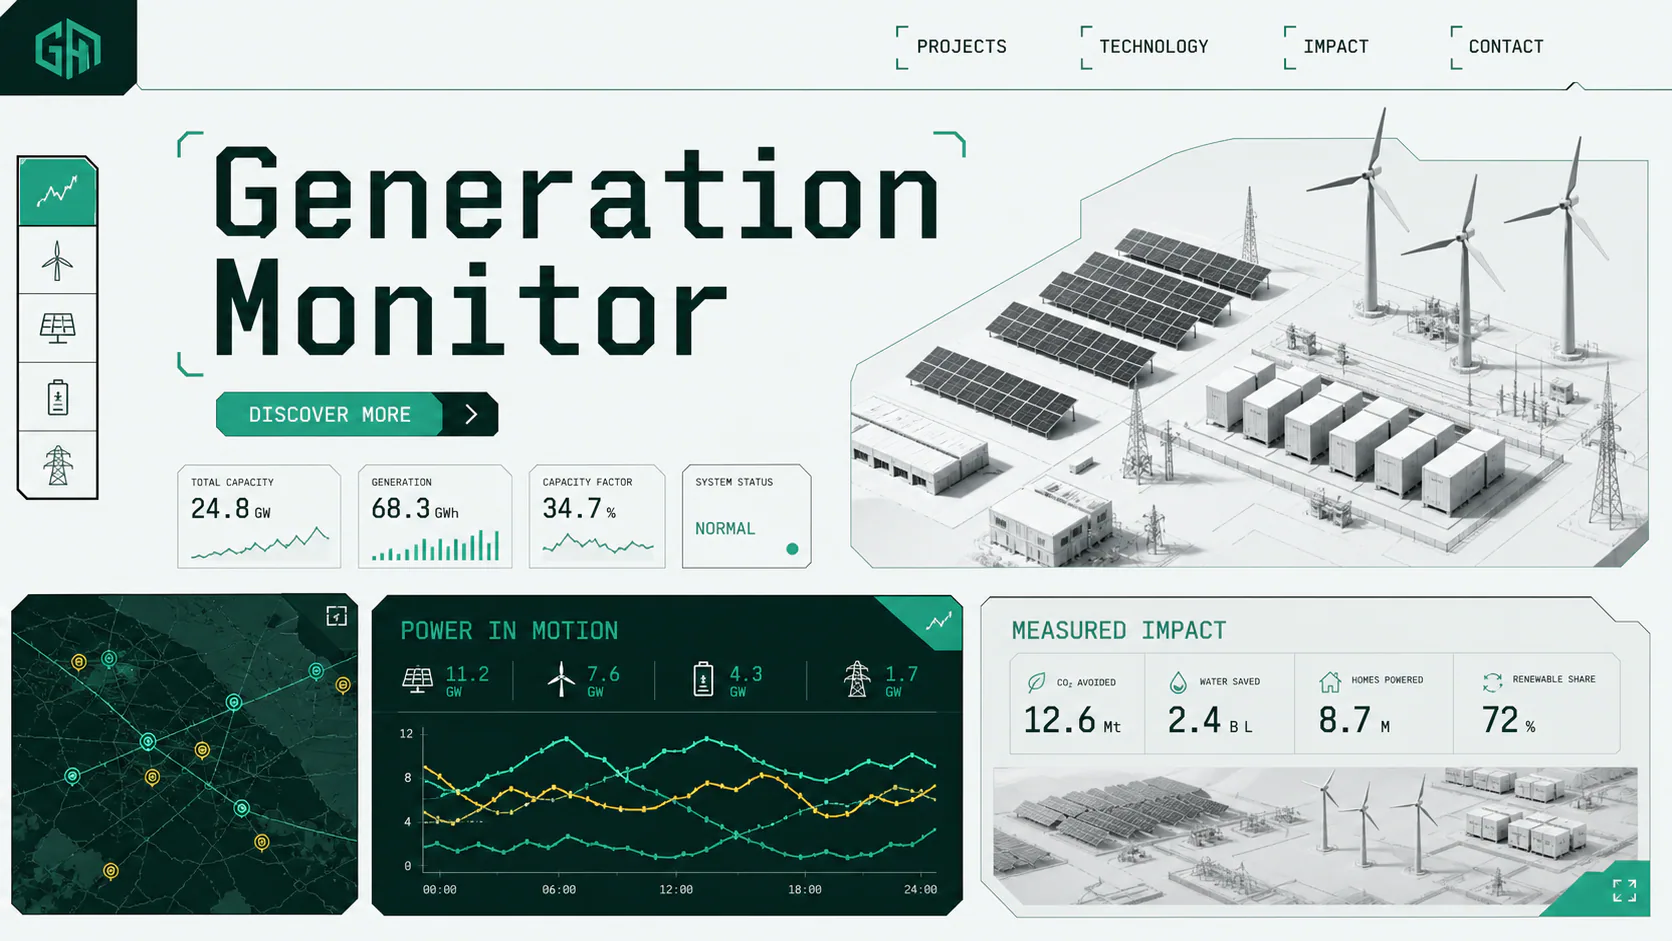
Portfolio output / 24h
Power in motion
00:0006:0012:0018:0024:00
Renewable operations intelligence / v4.8
Northstar Grid gives renewable operators one clear view across solar, wind, storage, and the network that connects them. Make the next dispatch decision with live context, not scattered reports.
 Portfolio map / live view
Control room / 01
A compact operational layer for teams balancing forecast, dispatch, maintenance, and the grid edge.
Portfolio output / 24h
Asset mix / now
+ 16 sites reporting within the expected interval
Measured impact / 02
Translate production data into the resource, reliability, and community context your stakeholders need.
System modules / 03
Start with the layer your team needs today. Add the rest as the portfolio grows.
Compare irradiance, inverter health, curtailment, and forecast variance by site.
Bring turbine availability, wind regime, yaw events, and wake loss into one view.
Track state of charge, reserve windows, dispatch history, and degradation signals.
Site briefing / 04
Tell us where the current picture breaks down. We will return a sample monitoring map shaped around your generation mix and operating rhythm.